Analyzing the Performance of Premier League's Top 10 Midfielders with Radar Charts
作者:网站小编文章来源: 发布日期:2024-02-12 07:25:04
Recently, I have been compiling player data from Wyscout and using radar charts to analyze their performances. Previously, I compared midfielders like Havertz, Grealish, and Maddison. This time, I wanted to directly compare the top 10 midfielders from the Premier League using radar charts.
Before we proceed, there are a few points that need to be emphasized:
- The top 10 Premier League teams include Arsenal, Aston Villa, Brighton, Chelsea, Liverpool, Manchester City, Manchester United, Newcastle, Tottenham, and West Ham.
- The selection of midfielders is based on players who have played in the midfield position according to Wyscout's definition. Additionally, players must have played at least 900 minutes and be considered regular starters based on specific team criteria.
- The data is based on Wyscout's statistics, but I have made further calculations based on my own understanding.
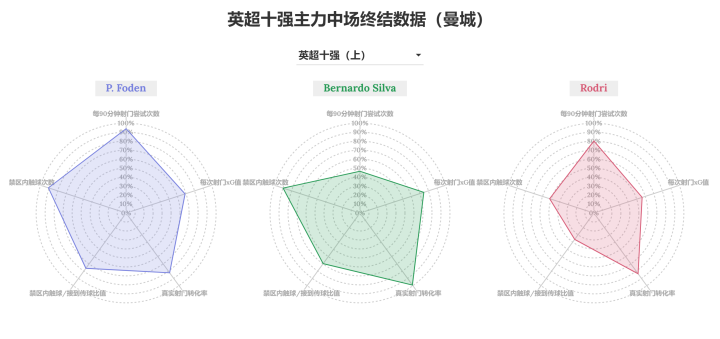
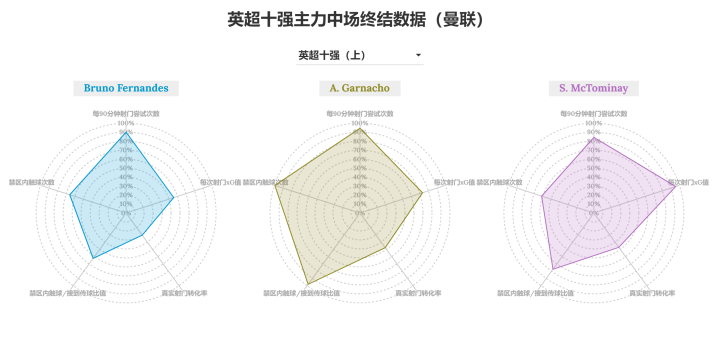
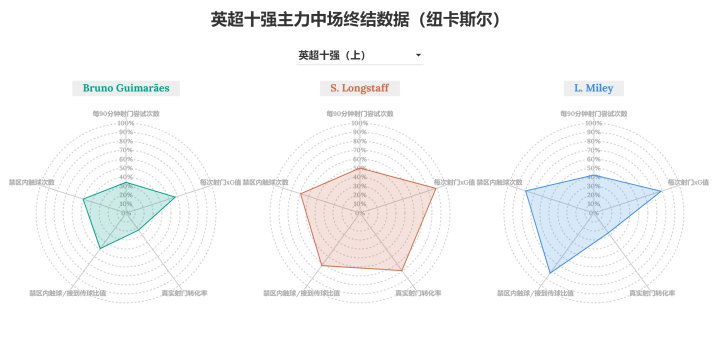
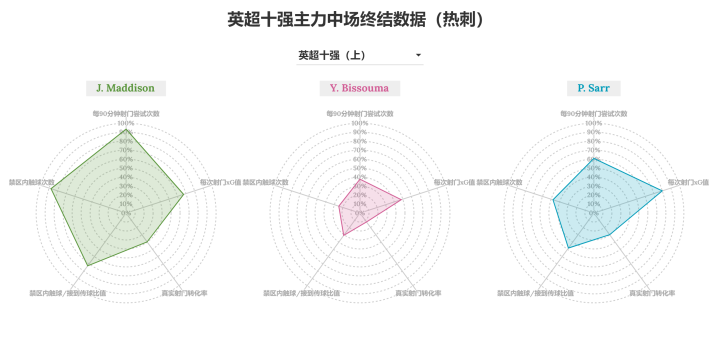
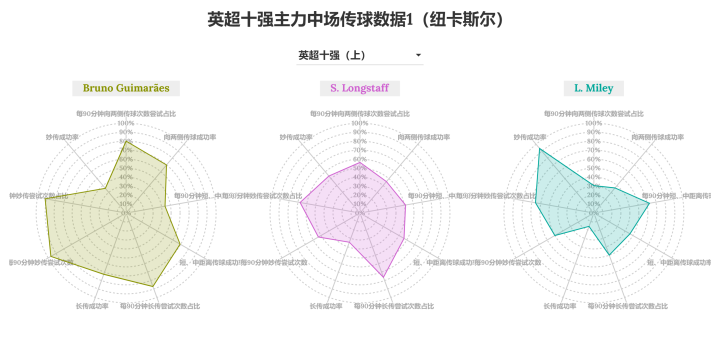
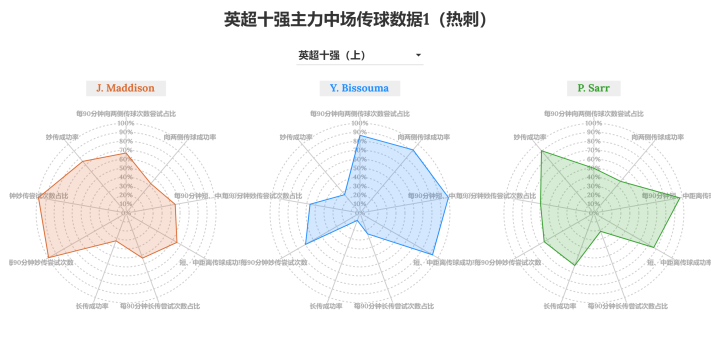
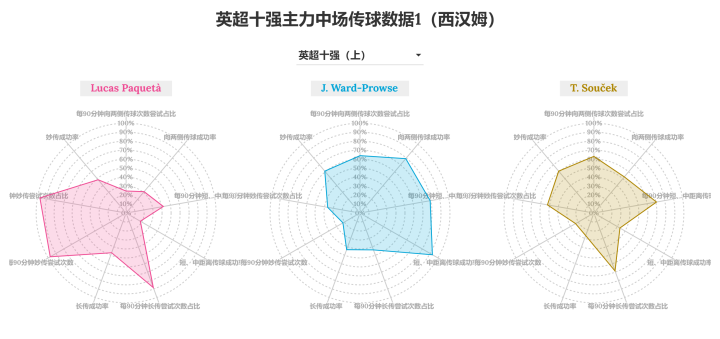
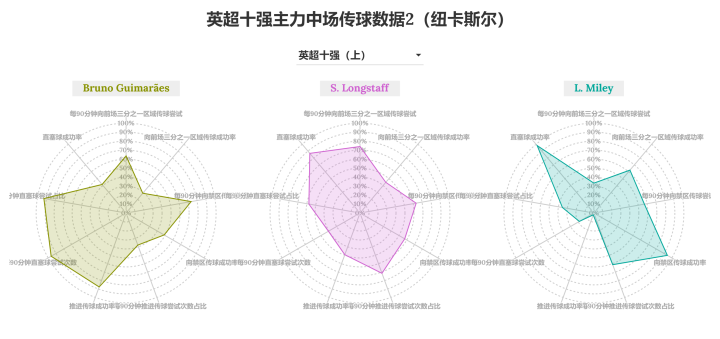
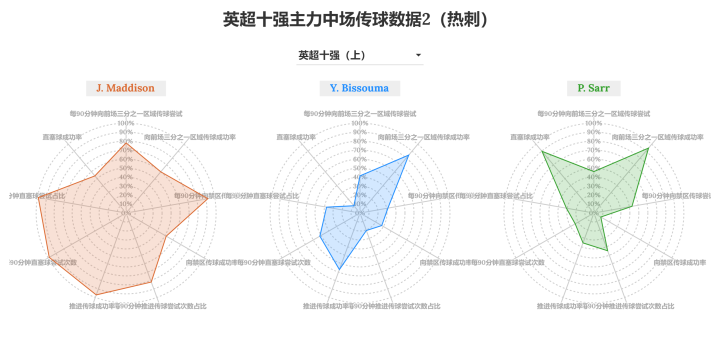
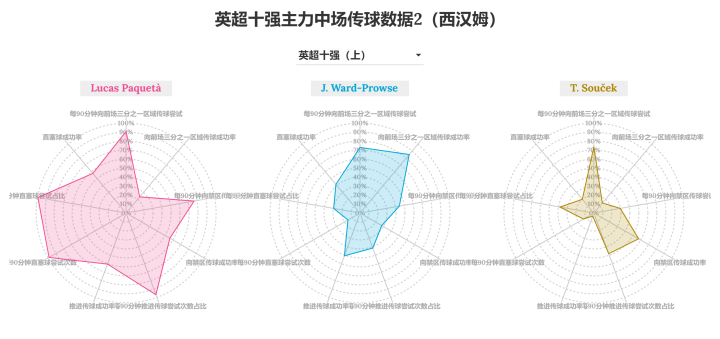
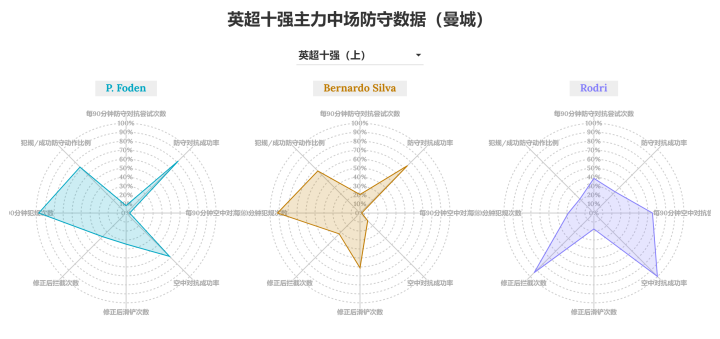
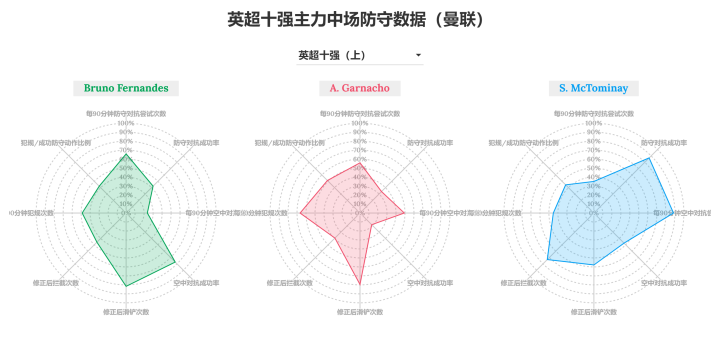
- Due to the limit of discussing only five teams at a time, I will split the analysis into two parts. This article will focus on Manchester City, Manchester United, Newcastle, Tottenham, and West Ham.
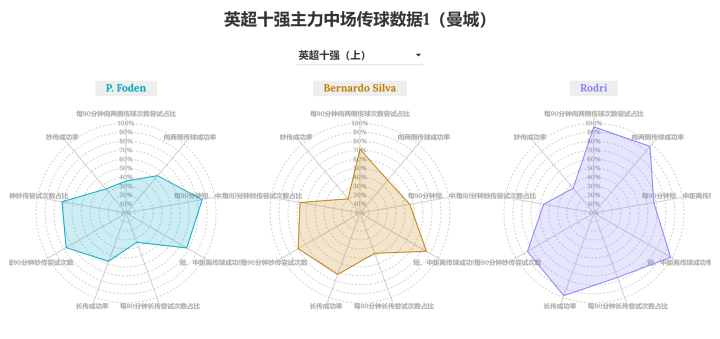
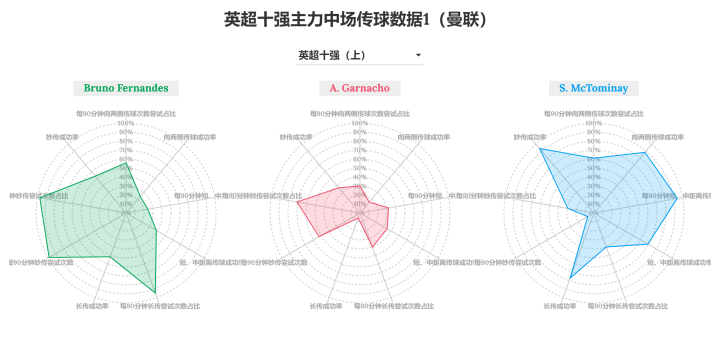
- The data dimensions include shooting, ball control, passing 1, passing 2, and defense. Why are passing indicators split into two groups? It is because Wyscout's passing data is extensive and cannot be captured in a single radar chart.
- The data is compared to players who have played at least 900 minutes in the top five leagues this season and have played in the midfield position.

- All data is ranked as a percentage. For example, if a player's shooting attempts reach the 90% mark, it means their performance surpasses 90% of the comparison group.

- Some negative data, such as fouls committed, have been ranked in reverse order.
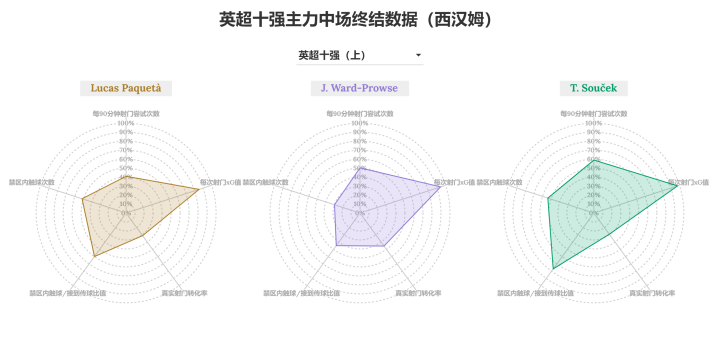
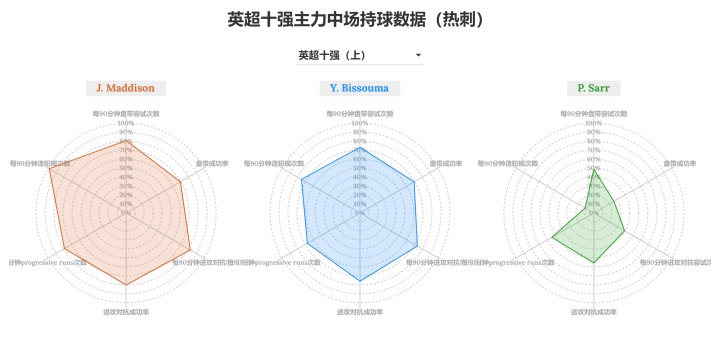
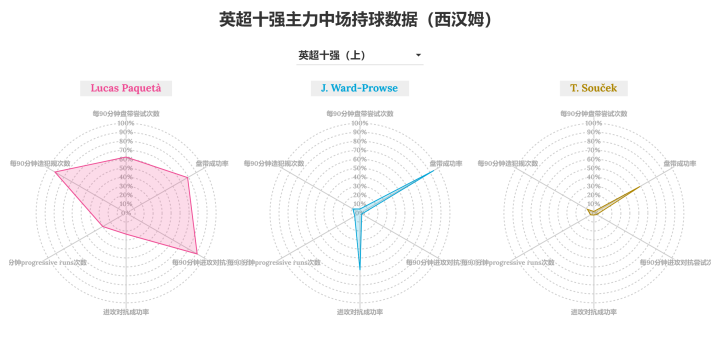
1. Shooting Data
Shooting data includes:
- Shots per 90 minutes
- Expected Goals (xG) per shot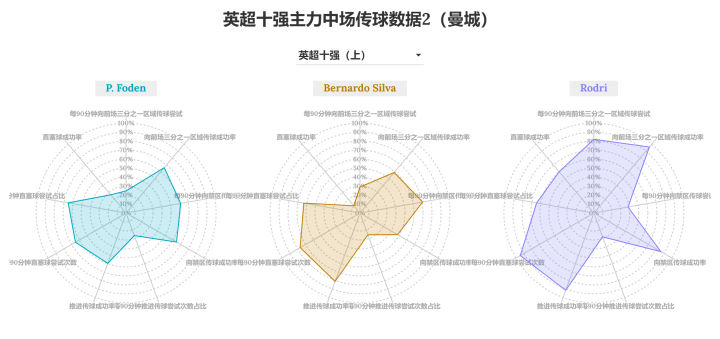

- True shooting percentage
 - Touches in opposition penalty area/received passes ratio
- Touches in the opposition penalty area.
Some key explanations for certain data:
1) Expected Goals (xG) per shot: This metric measures the quality of a player's shooting opportunities. It is influenced by both subjective and objective factors. Subjective factors refer to a player's ability to make well-timed runs, while objective factors include the player's tactical positioning and positioning within the formation.
2) True shooting percentage: This metric measures a player's shooting accuracy, calculated as "(Goals scored - Expected Goals) / Shot attempts." While this data is useful, it requires specific analysis depending on the context. One major factor that can influence this metric is the number of shot attempts. If a player has a low number of shot attempts, this metric may not accurately reflect their shooting ability. For example, if a player scores a spectacular goal but rarely takes shots afterward, their shooting percentage may appear high, even if their overall shooting ability is questionable.
相关新闻
- 卢卡库分享罗马之行
- 利物浦后防新星崭露头角 伤病后塑造冠军队伍
- 外国基金怀疑张康阳信用问题
- 哈里-威尔逊破门2助攻,富勒姆大胜卢顿
- 吉马良斯表现抢眼,助纽卡斯尔联获胜
- 荷兰名宿阿隆·温特讲述在国际米兰和拉齐奥的足球生涯
- 泪别法兰克福,长谷部诚告别效力球队十年
- 意甲国米贷款风波:橡树资本拒绝回应 张康阳指责受挫
- 迪尼评论:切尔西多样性和疯狂吸引观众,曼联卡塞米罗表现不佳
- 沙尔克官方宣布夏季训练营将再次前往奥地利米特西尔
- 德国名宿马特乌斯谈拜仁新教练选帅工作
- 波兰主帅普罗别日谈欧洲杯名单:卡什伤情不乐观,泽林斯基或有好消息
- 恩里克谈巴黎磨炼巴尔科拉,引援策略和比赛筹备
- 意甲联赛即将上演焦点之战
- 罗马、亚特兰大和尼斯竞相追逐法国右后卫让德雷